
Microservices Re-Explained 106 : Observability: Logs, Metrics, and Traces Are Not the Same Thing
What the three pillars actually mean, where each one breaks down in isolation, and how you tie them together into a system that tells the truth during an incident.

It was 11:47 PM on a Friday.
Checkout latency had spiked to 8 seconds. P99 was still climbing. Users were abandoning carts. The on-call engineer had been staring at logs for forty minutes.
The logs showed nothing obviously wrong. A few timeouts. Normal-looking errors. Nothing that screamed “this is the cause.”
“We don’t have enough logging,” someone said on the call.
They did have enough logging. They had gigabytes of logs. What they didn’t have was a way to understand what had actually happened — in what order, across which services, at what latency, for which request.
They had data. They did not have observability.
There’s a difference. Most teams learn it the hard way.
— Why the Distinction Actually Matters
Most engineers use these three words interchangeably. They are not interchangeable.
Each one answers a fundamentally different question. Each one breaks down in ways the other two cannot compensate for. When they’re treated as substitutes — or when only one or two are implemented — the result is a system that’s technically “monitored” but completely opaque when something actually goes wrong.
LOG
What happened?
Discrete, timestamped records of events. The what with full context.
MTR
How much, how often?
Numeric measurements over time. The shape of your system at a glance.
TRC
Where did time go?
Causally linked spans across services. The path of every request.
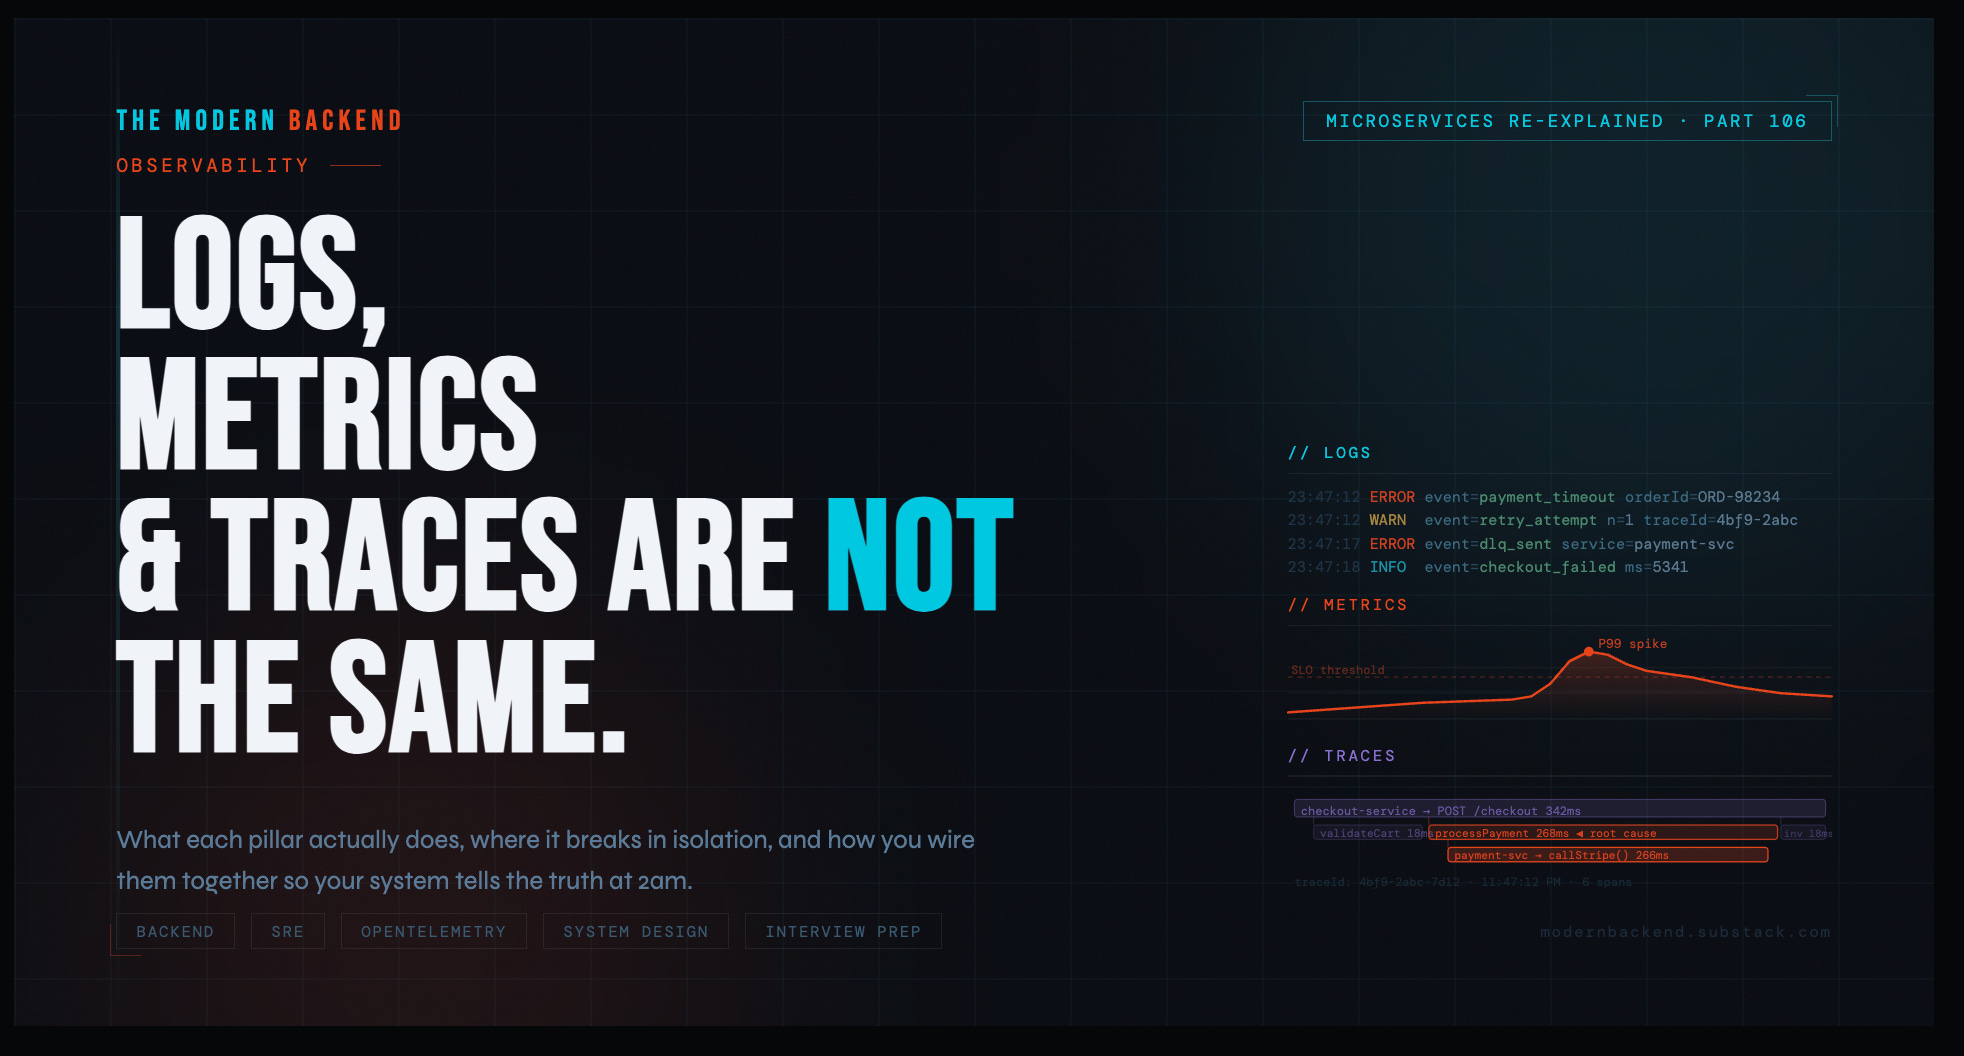
Logs tell you what happened. Metrics tell you how much and how often. Traces tell you where time went and why.
These are not redundant. They’re complementary. And you need all three before your observability stack can tell the truth under pressure.
The Modern Backend Interview Prep Kit
Java · Spring Boot · Microservices · DevOps · SRE · System Design
1. What Observability Actually Is
Before the pillars, get the definition right — because most teams have monitoring and call it observability.
Monitoring tells you that something is wrong. A dashboard goes red. An alert fires. Latency exceeded the threshold.
Observability tells you why something is wrong — by letting you ask arbitrary questions about the internal state of your system without needing to predict those questions in advance.
The classic framing: a system is observable if you can understand its internal state from its external outputs, without shipping new code to answer your question.
That’s the bar. Most systems don’t clear it.
The reason is almost always the same: teams add logs, metrics, or traces reactively — after an incident reveals a blind spot — rather than designing their observability stack deliberately before the incident happens. Good LLD includes observability hooks as first-class design decisions. Not afterthoughts. Not “we’ll add logging later.”
2. Logs: What They’re Good For and Where They Break
What Logs Actually Are
A log is a discrete, structured record that something happened at a point in time. It captures context at the moment of an event.
Good structured logging looks like this:
checkout-service — structured log event
{
  "timestamp": "2025-03-14T23:47:12.441Z",
  "level":     "ERROR",
  "service":   "checkout-service",
  "traceId":   "4bf9-2abc-7d12",
  "spanId":    "8a3c-1b22",
  "orderId":   "ORD-98234",
  "userId":    "USR-44102",
  "event":     "payment_gateway_timeout",
  "durationMs": 5003,
  "message":   "Payment gateway did not respond within 5s. Retrying."
}
Notice what’s in there: not just the event — the traceId, the orderId, the userId, the durationMs. Structured logs are queryable, filterable, joinable with other signals. Logs without structure are noise. "Error: timeout" logged as a plain string tells you almost nothing useful in a real incident.
What Logs Are Good For
Event details with full context. What was the payload? What did the service decide and why? What was the exception and its stack trace? Metrics and traces don’t carry this. Logs do.
Debugging specific cases. If you have the orderId of a failing request, structured logs let you reconstruct exactly what the service saw and did, step by step.
Audit trails. Who did what, when, to which resource. A logs job. Not metrics. Not traces.
Unexpected state capture. A warning when a valid-but-unusual condition is hit. An error when an exception is caught. Discrete events — log them.
Where Logs Break Down
Volume and cost. At meaningful scale, logs are expensive to store and slow to query. Shipping every log line for every request at 10,000 RPS is not free. Teams either pay a lot, or they sample aggressively — which means the log you need might not be there when you need it.
Aggregation is painful. You cannot easily ask “what percentage of checkout requests failed in the last 5 minutes?” from raw logs without a heavy query layer on top. This is what metrics are for. Using logs to answer aggregate questions is a sign you’re missing the second pillar.
No request topology. Logs tell you what happened inside one service. They don’t tell you how that service connects to the twelve others that handled the same request, or which of those twelve is the one making everything slow.
Logs are the deepest signal — but they’re blind to the shape of a system. They see trees, not the forest.
3. Metrics: What They’re Good For and Where They Break
What Metrics Actually Are
A metric is a numeric measurement taken at a point in time, aggregated over a window, and stored efficiently for fast querying. Metrics are cheap, fast, and built for graphs and alerts.
There are four types worth understanding:
Prometheus metric types
# Counter — only goes up. Use for: requests, errors, events.
http_requests_total{service="checkout", status="500"} 142

# Gauge — goes up or down. Use for: queue depth, active connections, memory.
jvm_memory_used_bytes{area="heap"} 412381184

# Histogram — samples observations into buckets. Use for: latency, sizes.
http_request_duration_seconds_bucket{le="0.5"}   9801
http_request_duration_seconds_bucket{le="1.0"}   9944
http_request_duration_seconds_bucket{le="5.0"}   10000

# Summary — like histogram but client-side quantiles.
# Generally prefer histograms for server-side aggregation.
What Metrics Are Good For
Alerting. Metrics are how you know something is wrong. A spike in http_request_duration_seconds P99. A rise in checkout_errors_total. A drop in order_throughput. You cannot run a reliable on-call rotation without metrics.
Trend analysis and capacity planning. How has latency changed over the last 30 days? Are we approaching our DB connection pool limit? Metrics answer these questions efficiently at any time scale.
Dashboards. Real-time system health. A good metrics dashboard tells an engineer the state of the system in 10 seconds. Logs cannot do this at scale.
SLO tracking. Your error budget is a metric. Your P99 latency SLI is a metric. You cannot run SRE practices without a solid metrics layer.
Where Metrics Break Down
They don’t tell you why. Metrics tell you that checkout P99 jumped from 200ms to 8 seconds at 11:43 PM. They do not tell you which service caused it, which query is running slow, or which downstream dependency is misbehaving. You know something is wrong. You don’t know what.
High-cardinality is expensive. You cannot efficiently use userId or orderId as a metric label. The cardinality explodes your time-series database. Metrics work at the system level. They don’t work at the individual request level. That’s what logs and traces are for.
No causality. Two metrics spiking at the same time doesn’t mean one caused the other. Metrics show correlation. They don’t show which service in your call chain is the root cause.
Metrics are the alarm system. They tell you the building is on fire. They don’t show you which room it started in.
The Modern Backend Interview Prep Kit
Java · Spring Boot · Microservices · DevOps · SRE · System Design
4. Traces: What They’re Good For and Where They Break
What Traces Actually Are
A trace is a causally linked record of all operations that happened as a result of a single request — across every service it touched. Each operation is a span. Every span knows its parent span. Together they form a tree that maps the full path of a request through your system.
OpenTelemetry trace structure — checkout request
Trace ID: 4bf9-2abc-7d12
│
├─ [0ms → 342ms]  checkout-service: POST /checkout          # root span
│    ├─ [2ms → 18ms]   checkout-service: validateCart()
│    ├─ [20ms → 290ms] checkout-service: processPayment()
│    │    └─ [22ms → 288ms] payment-service: POST /charge   # ← 266ms here!
│    │         ├─ [24ms → 30ms] payment-service: validateCard()
│    │         └─ [31ms → 287ms] payment-service: callStripe()  # ← root cause
│    ├─ [292ms → 310ms] inventory-service: reserveItems()
│    └─ [312ms → 338ms] notification-service: queueEmail()
In one glance, you can see that the payment service is consuming 266ms of the total 342ms request time — and specifically, the Stripe API call inside it is the bottleneck. No amount of log searching would have surfaced this as clearly or as quickly.
What Traces Are Good For
Root cause isolation in distributed systems. The checkout is slow. Is it the payment service, the inventory service, the database behind the inventory service, or the external Stripe call? A trace tells you in seconds.
Understanding service dependencies. Traces map your actual call graph at runtime — not the assumed one from your architecture diagram.
Performance regression hunting. Before your deploy, P99 was 200ms. After, it’s 600ms. A trace comparison tells you exactly which span got slower.
Distributed debugging without log correlation hell. Instead of correlating log lines across six service log streams by timestamp, a trace stitches the full story together automatically.
Where Traces Break Down
Sampling means you might not have the trace you need. Head-based sampling — deciding to trace a request before you know its outcome — means you might sample out the one slow request you needed to debug. Tail-based sampling solves this but adds infrastructure complexity.
Instrumentation cost is real. Getting traces requires instrumentation — either automatic (via OpenTelemetry agents) or manual (adding span boundaries to your code). Automatic instrumentation covers the common paths. Custom business operations require manual work.
Traces don’t explain decisions. A trace shows you that applyDiscountRules() took 40ms. It doesn’t tell you what the input was, what rules evaluated, or what the output was. That’s a log event inside that span.
Traces show you the skeleton of a request. Logs put flesh on the bones.
5. How They Actually Work Together
The three pillars are not three separate systems that happen to coexist. In a well-built observability stack, they are one unified workflow.
Here’s how the incident from the introduction should have gone:
Incident workflow — three-pillar response
STEP 1 — Metrics surface the problem
Alert fires: checkout P99 latency > 3s for 5 minutes
Dashboard: spike correlates with a deploy at 23:41

STEP 2 — Trace narrows the cause
Open trace for a slow checkout request (sampled at P99)
payment-service.callStripe() span: 5,002ms
All other spans: normal

STEP 3 — Log reveals the detail
Filter logs by traceId: 4bf9-2abc-7d12
Found in payment-service:
{
  "event": "stripe_api_call",
  "endpoint": "/v1/charges",
  "responseCode": 429,  ← rate limited
  "retryAfterMs": 4800,
  "message": "Stripe rate limit hit. Retrying after backoff."
}

Root cause: Stripe rate limit triggered by a burst of test charges
from a load test that wasn't properly gated by environment flag.
Metrics caught it. Traces isolated it. Logs explained it. Total time to root cause: under 6 minutes. Without the trace, you’re doing log archaeology across multiple services by hand. Without structured logs, the trace gets you to the right service but not to the Stripe rate limit detail. Without metrics and alerting, you find out from a user complaint, not a dashboard.
The Correlation Layer Is the Critical Piece
The thing that makes all three pillars actually work together is the trace ID. Every log line emitted during a request should carry the traceId. Every metric emitted during a request should be tagged by service, endpoint, and status. The trace carries the full span tree.
When this is in place, you can start from a metric alert, click through to a trace, then jump directly to the relevant log lines — all in one flow, without manual correlation by timestamp or by eye.
This is what OpenTelemetry is standardizing: a single SDK that emits traces, logs with trace context, and metrics — all correlated. If you’re not on this path, get on it.
Spring Boot — OpenTelemetry setup (key config)
# application.yml — wire OTel exporter to your collector
management:
  tracing:
    sampling:
      probability: 1.0   # 100% in dev; use 0.1-0.5 in prod, or tail-based

otel:
  exporter:
    otlp:
      endpoint: http://otel-collector:4318
  service:
    name: checkout-service

# In your logs (Logback/MDC), add traceId automatically:
# Spring Boot 3 + Micrometer Tracing does this for you out of the box.
# Your log pattern should include: %X{traceId} %X{spanId}
The Modern Backend Interview Prep Kit
Java · Spring Boot · Microservices · DevOps · SRE · System Design
6. Building a System That Tells the Truth
Observability is a design-time decision, not a post-incident addition. The best time to define what you log, what you measure, and what you trace is during LLD — before you write the implementation. Here’s what that looks like concretely:
LLD observability spec — checkout-service
// ── METRICS ──────────────────────────────────────────────────────
checkout_requests_total          // counter | tags: status, paymentMethod
checkout_duration_seconds        // histogram | tags: status
checkout_payment_failures_total  // counter | tags: reason, gateway
checkout_cart_value_rupees       // histogram (business metric)

// Alert: checkout_payment_failures_total rate > 5/min for 3 min → PagerDuty
// Alert: checkout_duration_seconds P99 > 2s for 5 min → Slack #oncall

// ── TRACES ───────────────────────────────────────────────────────
// Root span: POST /checkout
// Child spans (manual instrumentation):
//   checkout.validateCart(cartId)
//   checkout.processPayment(orderId)  ← always add orderId as span attribute
//   checkout.reserveInventory(items[])
//   checkout.sendConfirmation(userId)

// ── LOGS ─────────────────────────────────────────────────────────
// INFO  — checkout.initiated   { orderId, userId, cartId, totalAmount }
// INFO  — checkout.completed   { orderId, durationMs, paymentMethod }
// WARN  — checkout.retrying    { orderId, attempt, reason }
// ERROR — checkout.failed      { orderId, stage, errorCode, message }
// All logs must include: traceId, spanId, service, environment
This takes 20 minutes to write in LLD. It saves hours in the next incident — because you’ve defined before the incident what the system will emit, what the alert thresholds are, and exactly what context will be in every log line.
7. Common Mistakes
Treating Logs as the Only Signal
The most common mistake in smaller teams. No metrics, no traces — just logs and a prayer. This works until the first distributed incident, at which point you’re manually searching log streams across five services by approximate timestamp. You will miss things. The incident will take longer than it should.
Logging Too Much at INFO, Not Enough at DEBUG
High-volume INFO logs that carry no useful context are noise. They increase cost and slow queries without improving debuggability. The rule: INFO should mark meaningful events in the lifecycle of a request. DEBUG should carry the verbose detail. Run DEBUG in production only when actively investigating — not always.
No Cardinality Discipline in Metrics
Adding userId as a Prometheus label feels obvious until your time-series database is storing 10 million distinct series and your dashboards take 30 seconds to load. Metrics labels must have bounded cardinality. For per-user or per-order analysis: use logs and traces, not metrics.
Traces Without Span Attributes
A trace that tells you a span took 500ms is half-useful. A trace that also tells you the orderId, the itemCount, and the discountCode applied during that span is the one you can actually debug with. Add business context to spans as attributes. Always.
No Correlation Between Pillars
Three separate systems — Datadog for metrics, Kibana for logs, Zipkin for traces — each with no shared identifier. During an incident, you’re switching tabs and manually correlating events by eyeballing timestamps. This is the configuration that produces the 11:47 PM Friday incident from the opening story. The fix is a shared traceId and a platform that can join across all three signals.
The Modern Backend Interview Prep Kit
Java · Spring Boot · Microservices · DevOps · SRE · System Design
8. Interview Prep: Observability Questions
8.1 — Conceptual Questions
In your own words, what is the difference between monitoring and observability? Where does one end and the other begin?
Explain the three pillars of observability and what unique question each one answers.
What is a trace ID, and why is it critical to have it present in both logs and traces?
What is cardinality in the context of metrics, and why does high cardinality cause problems in systems like Prometheus?
What is tail-based sampling vs head-based sampling in distributed tracing? What are the trade-offs?
Why is structured logging preferred over unstructured logging in production systems?
8.2 — Practical / Scenario Questions
Your checkout service P99 latency just spiked from 200ms to 4 seconds. Walk me through exactly how you would use logs, metrics, and traces together to identify the root cause.
Design the observability layer for a payment processing service. What metrics would you emit? What would you log? Where would you add trace spans?
You’re seeing elevated error rates in your order service metrics, but the logs look clean. What could explain this, and how would you investigate?
How would you implement distributed tracing across a Spring Boot microservices system? What libraries would you use, and what does the propagation mechanism look like?
A downstream service your application depends on starts returning slow responses intermittently. How does your observability stack help you detect, localize, and prove the issue — versus blaming your own service?
You need to set up alerting for a new service. Walk me through how you decide what to alert on, at what thresholds, and how you avoid alert fatigue.
8.3 — Trade-Off Questions
When would you choose 100% trace sampling vs probabilistic sampling? What factors drive that decision in a high-throughput production system?
How do you decide what log level to assign to a given event? What’s the cost of over-logging at INFO vs under-logging at WARN?
Your team is debating between a managed observability platform (Datadog, New Relic) vs a self-hosted stack (Prometheus, Grafana, Jaeger, ELK). Walk me through the trade-offs.
How would your observability design change for a service processing 500 RPS vs one processing 50,000 RPS?
What’s the risk of relying on synthetic monitoring alone (uptime checks, health endpoints) without the three pillars? What does it miss?
8.4 — SRE / Production Questions
What is an SLI, SLO, and SLA? How do metrics feed into each of them?
What is an error budget, and how does your observability stack help you track and enforce it?
How do you design a runbook so that an on-call engineer with no prior context on a service can diagnose an incident using only your dashboards, logs, and traces?
You’re building a new microservice from scratch. At what point in the development process do you add observability, and what does “done” look like before you ship to production?
How would you conduct a post-incident review using your observability data? What signals would you pull, and what questions would you try to answer?
The Modern Backend Interview Prep Kit
Java · Spring Boot · Microservices · DevOps · SRE · System Design
Great perspective!